
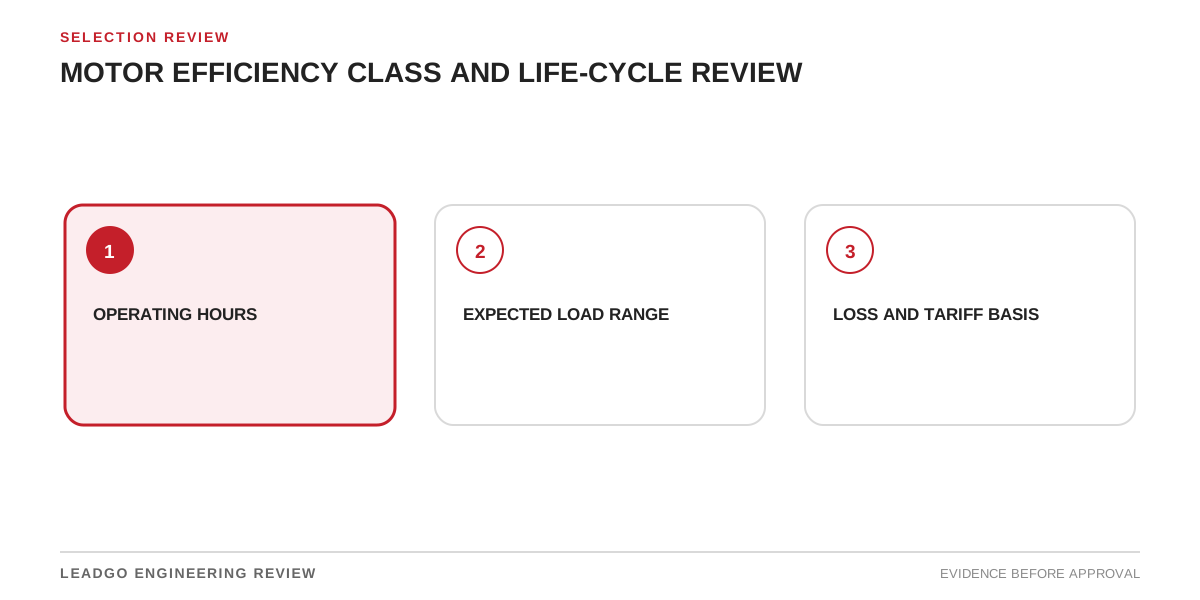
An efficiency class is a useful screening label, but it is not an energy bill. Motor operating cost depends on the power demanded by the driven equipment, efficiency at the actual load points, annual hours, controls and energy price. A buyer who compares only rated efficiencies may overstate savings, overlook a poor duty match or combine motor and process benefits without showing which change produced them.
A good lifecycle review does not need false precision. It needs an auditable boundary, a load profile, comparable supplier data and a calculation that another engineer can update when hours or tariffs change.
Applicability boundary for an efficiency comparison
Use this method when comparing technically acceptable motor options, evaluating a replacement, reviewing a premium-efficiency quotation or supporting an energy project. It is most valuable for motors with long annual operating hours, meaningful price differences or variable loading.
First prove that each option can perform the duty. Efficiency does not compensate for inadequate starting torque, thermal margin, hazardous-area suitability, cooling, speed range or mechanical fit. Exclude technically infeasible options before lifecycle scoring.
Keep the calculation boundary explicit. A motor-only comparison uses shaft output and motor input. A power-drive-system comparison also includes the converter. A system optimisation may include pump, fan, compressor, throttling or process-control effects. These are related but should not be blended into one unexplained saving.
The method is not a guarantee of future energy use. Production, weather, wear and operating practice change. Present scenarios and sensitivity rather than treating a forecast as a meter reading.
Inputs that control the result
| Input | Preferred evidence | Why it matters | Treatment if uncertain |
|---|---|---|---|
| Required shaft power by operating state | Process study, measured power or validated model | Establishes useful output demanded | Use low/base/high load cases |
| Annual hours in each state | Historian, operating schedule or production plan | Weights energy use | Separate planned and observed hours |
| Motor efficiency at each load | Supplier curve or declared/test data | Converts output to electrical input | Do not copy rated value across all loads |
| Converter efficiency where applicable | Drive data for load and speed | Completes drive-system boundary | Show motor-only and drive-inclusive cases |
| Energy tariff | Approved blended or time-based cost | Converts energy to operating cost | State currency, date and escalation basis |
| Purchase and adaptation cost | Comparable quotations and work estimate | Establishes initial difference | List inclusions and exclusions |
| Maintenance difference | Evidence-based service plan | May change lifecycle cost | Keep equal if no supportable difference |
| Service horizon | Asset or project plan | Sets accumulation period | Test more than one horizon |
| Discount/escalation basis | Finance-approved assumptions | Converts future cash flows | Show undiscounted energy too |
| Availability or production effect | Reliability study or documented constraint | Can dominate small energy differences | Keep separate from energy unless evidenced |
Load-weighted calculation tool
For each load bin, calculate annual electrical energy as:
Energy = shaft output power ÷ motor efficiency ÷ drive efficiency × annual hours
Use efficiency and drive efficiency as decimals. Omit the drive term for a line-fed motor or set it to 1.00. Sum all bins. The annual energy-cost difference is the energy difference multiplied by the approved tariff. Simple payback is the additional initial cost divided by annual operating-cost saving, provided both use the same scope.
The following illustrative example teaches the method; it is not a LEADGO product claim, quotation or customer case.
| Load bin | Shaft output | Annual hours | Option A motor efficiency | Option B motor efficiency | A annual input energy | B annual input energy |
|---|---|---|---|---|---|---|
| High duty | 150 kW | 2,000 h | 95.0% | 96.0% | 315,789 kWh | 312,500 kWh |
| Normal duty | 100 kW | 3,000 h | 94.5% | 95.6% | 317,460 kWh | 313,808 kWh |
| Low duty | 50 kW | 1,000 h | 92.0% | 93.5% | 54,348 kWh | 53,476 kWh |
| Total | — | 6,000 h | — | — | 687,597 kWh | 679,784 kWh |
In this illustration, the calculated difference is about 7,813 kWh per year. At an illustrative energy price of 0.10 currency units per kWh, the annual difference is about 781 currency units. If Option B costs 4,000 more on a comparable installed basis, simple payback is about 5.1 years. Changing tariff, load or hours changes the result; those inputs must not be mistaken for market facts.
The example also shows why subtracting efficiency percentages is misleading. Electrical input is output divided by efficiency, and each operating point has its own weighting.
Lifecycle-cost decision steps for procurement
- Define the shaft-duty envelope and reject options that cannot meet starting, thermal, speed or environmental requirements.
- Choose motor-only, drive-system or process-system boundary and keep it consistent.
- Build load bins from measured data where available; otherwise document the engineering estimate and uncertainty.
- Request comparable efficiency data at relevant load and speed points, with the test or declaration basis.
- Calculate annual input energy by bin for each option.
- Add converter losses only where applicable and comparable.
- Compare installed initial cost, including adaptation, controls, cable, filter, foundation and commissioning differences.
- Add maintenance or availability differences only when supported by evidence.
- Run low, base and high scenarios for hours, tariff and service horizon.
- Record the preferred option, sensitivity, assumptions and conditions that could reverse the decision.
Common lifecycle errors that weaken efficiency claims
Comparing efficiency classes outside their scope. Confirm that the cited classification applies to the motor technology, rating and supply arrangement. A marketing label is not a substitute for the applicable declaration.
Using rated efficiency at low load. Part-load losses do not scale directly with output. Request the data needed for the actual profile.
Assuming nameplate load from rated power. Rated output is capability, not measured demand. A 200 kW motor does not necessarily deliver 200 kW throughout the year.
Double-counting variable-speed savings. Reducing pump or fan speed may save far more process energy than a motor-efficiency change. Attribute the process-control saving separately from the difference between motors.
Ignoring power factor or demand-charge treatment. Efficiency and power factor are different. If the tariff includes demand or reactive penalties, model those terms explicitly rather than embedding them in the kWh price.
Comparing purchase price with installed cost. A different frame, mass, cable, drive, filter or foundation may change project cost. Confirm interfaces before claiming payback.
Inventing maintenance savings. A higher efficiency class does not by itself prove longer bearing or winding life. Include reliability benefits only when the design and duty evidence supports them.
Reporting one payback without sensitivity. Hours and tariffs often dominate the answer. A range is more useful than an exact result built on weak assumptions.
Efficiency data to request from the supplier
Ask for guaranteed or declared rated efficiency and the applicable test method, plus efficiency at the load points needed for the study. For variable-speed duty, request performance across relevant torque, speed and cooling conditions and clarify whether figures include the drive. Obtain losses or input data in a form that can be reconciled with the calculation.
Request rated output, voltage, frequency, speed, service duty, starting performance, thermal limits, cooling, permitted load range, dimensions, mass, bearings, lubrication, noise and vibration basis. These inputs confirm technical equivalence and reveal adaptation cost.
The commercial offer should separate motor, drive, auxiliaries, testing, documentation, transport, installation support and exclusions. If an efficiency guarantee has a tolerance or test-verification condition, include it in bid comparison and acceptance planning.
Lifecycle acceptance and calculation-close conditions
Close the review when all options meet the same controlled duty; load bins and annual hours have sources; performance figures use stated methods and boundaries; tariff, currency, horizon and financial assumptions are dated; installed-cost differences are included; and sensitivity shows which assumptions control the result.
For contractual acceptance, state whether efficiency will be accepted from certified declaration, routine evidence, a type-test record or project testing. Define the applicable standard, method, tolerance and disposition before manufacture. Do not promise a field energy result from a factory motor test because process load and site operation remain outside that boundary.
After commissioning, meter a suitable baseline if the project requires savings verification. Record production or process state alongside electrical data. Update the model with actual hours and load distribution; retain the original decision case so forecast-versus-observed differences remain visible.