
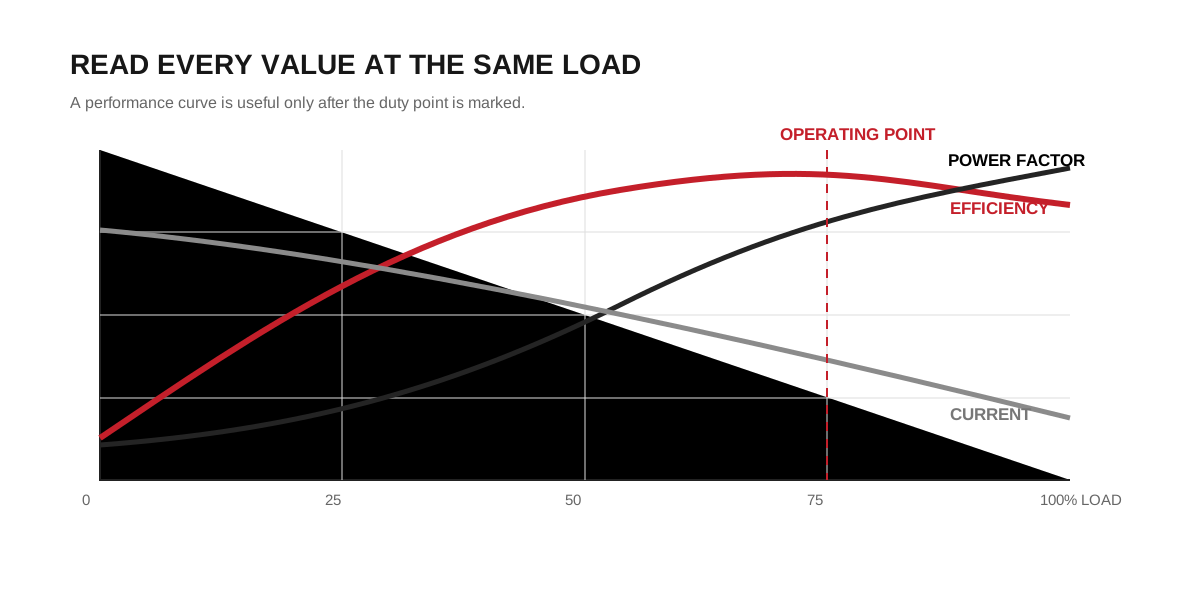
A motor performance curve is a map of one tested design. It shows how the machine behaves away from the single rated point printed on the nameplate. For a buyer, its value is practical: it reveals whether an apparently correct motor will operate efficiently, draw acceptable current and retain enough thermal margin at the load the machine actually imposes.
The first question is therefore not “What is the peak efficiency?” It is “Where will this application sit on the horizontal load axis?”
Start with the axes and test conditions
Most curves place output load on the horizontal axis as a percentage of rated shaft power. A 75 kW motor delivering 45 kW is at 60% load. Several vertical scales may then show efficiency, power factor, current, speed or slip.
Before comparing two charts, check that they use the same voltage, frequency, connection and test basis. A 50 Hz curve cannot be transferred directly to a 60 Hz duty, and an inverter-fed result is not automatically equivalent to a sinusoidal-supply result. The distinction is explained further in what an inverter-duty efficiency figure measures.
Read all curves at one operating point
Draw a vertical line from the expected load. Every intersection along that line belongs to the same operating condition.
| Curve | What it tells you | What to watch |
|---|---|---|
| Current | Electrical demand at that shaft load | Cable, starter and protection coordination |
| Efficiency | Output power divided by input power | Energy cost across the real duty cycle |
| Power factor | How effectively current produces useful power | Transformer and feeder loading |
| Speed or slip | Shaft speed under load | Process speed and driven-equipment match |
| Torque | Available turning effort | Acceleration and overload requirement |
Reading only one line can produce a bad selection. A lightly loaded motor may still show respectable efficiency while its power factor has already deteriorated. A replacement can meet rated power but run at a different full-load speed, shifting the duty point of a pump or fan.
Current is not a straight load meter
An induction motor needs magnetising current even when it produces little shaft output. Current therefore does not fall in direct proportion to load, particularly below half load. Estimating a 30% load simply by taking 30% of nameplate current is wrong.
For field work, input power measurement is usually more informative. Speed can also help when a reliable speed-versus-load curve is available, because slip increases with load. The US Department of Energy describes input power, amperage and speed as three estimation routes, while warning that each carries assumptions.
Efficiency and power factor describe different losses
Efficiency answers how much input power becomes shaft output. Power factor describes the phase relationship and waveform contribution behind apparent power. One does not substitute for the other.
An oversized motor can spend its life far left of the intended operating region. Fixed losses then represent a larger fraction of useful output, while the magnetising current depresses power factor. That does not mean every lightly loaded motor must be replaced. Operating hours, measured load, energy price, replacement cost and process risk decide whether the correction pays; use the method in our motor total-cost-of-ownership worksheet.
Speed curves matter on pumps and fans
Synchronous speed is set by frequency and pole count. The rotor of an induction motor runs below it, and the difference is slip. Two motors with the same power and pole count can have different rated speeds because their slip differs.
That small speed change may matter on a centrifugal load. Flow, pressure and power respond to speed, so replacing a 1470 r/min motor with one that runs closer to 1490 r/min can move the operating point. This is why matching a replacement fan motor requires more than the kW value.
Use the curve as a screening tool
For a new selection, mark at least three points: minimum continuous load, normal load and maximum expected load. Then check:
- current against the feeder and protective device;
- efficiency and power factor at the hours-weighted operating point;
- speed against the driven equipment;
- starting and accelerating torque separately from the running curve;
- temperature rise or permitted duty where the load is cyclic.
The published curve is design data, not a guarantee that every site condition is represented. High ambient temperature, altitude, voltage unbalance and VFD harmonics can all move the thermal result. State those conditions in the enquiry rather than trying to correct the chart after purchase.
The buyer’s conclusion
A performance curve is useful only when it is tied to the load profile. Ask the supplier for the curve of the quoted frame, pole count and winding—not a generic family graphic. Mark the real operating points and compare every parameter on the same vertical line. That turns a decorative chart into a selection document.