
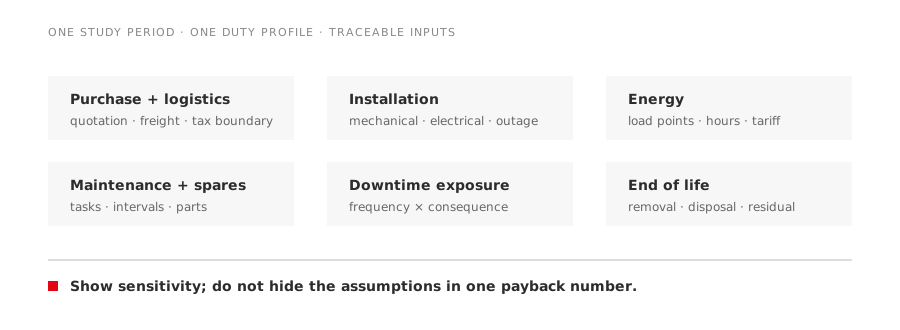
“Purchase price is only five percent” is memorable, but it is not a calculation. For a motor that runs continuously, energy can dominate. For a standby pump or an intermittent actuator, it may not. A buyer needs a worksheet that reveals which assumption changes the result.
Direct answer
Compare motor options over one agreed study period using six cost buckets:
- purchase and commercial charges;
- installation and commissioning;
- electricity at the real operating profile;
- planned maintenance and spares;
- expected failure and downtime exposure;
- removal, disposal and residual value.
Keep compliance and technical suitability as pass/fail gates. A motor with a low calculated TCO is still unacceptable if its starting current, hazardous-area marking, mechanical interface or duty is wrong.
Start with a common boundary
Two bids cannot be compared if one includes a drive, coupling and commissioning while the other includes only the bare motor. Write the boundary at the top of the worksheet.
| Input | Option A | Option B | Source or owner |
|---|---|---|---|
| Study period, years | Project finance | ||
| Purchase and freight | Supplier quotation | ||
| Installation and alignment | Contractor estimate | ||
| Annual operating hours | Historian or production plan | ||
| Load/speed profile | Metering or process model | ||
| Electricity tariff | Utility invoice | ||
| Planned maintenance | Maintenance plan | ||
| Expected downtime exposure | Operations and reliability | ||
| End-of-life cost/value | Site policy |
Use one currency, tax treatment and base date. State whether cash flows are discounted. If the comparison is only a screening estimate, say so.
Calculate energy from the operating point
For a steady operating point, electrical input is approximately:
input kW = required shaft output kW / motor efficiency
Annual energy is input power multiplied by operating hours. Annual cost is energy multiplied by the applicable tariff. Repeat the calculation for each meaningful load or speed band, then add them.
Do not use rated output as though it were measured load. An oversized motor operating lightly loaded may change both efficiency and power factor. For VFD systems, include converter loss and use the motor-drive efficiency at relevant torque and speed points where reliable data exist.
The article on IE3, IE4 and IE5 lifecycle selection explains why the label alone does not predict project savings.
Installation cost can reverse a simple price comparison
A replacement can require a new baseplate, coupling, cable, breaker, starter or VFD setting. Frame size, shaft height, foot dimensions, mass and terminal-box position affect labour and outage duration.
Record at least:
- foundation and mechanical adaptation;
- lifting and access requirements;
- coupling, guard and alignment work;
- cables, starter, protection and control changes;
- VFD, filters, reactors or independent fan;
- testing, commissioning and documentation;
- production outage required for the change.
An efficiency upgrade that fits the existing interface has a different project cost from one that triggers a mechanical and electrical redesign.
Treat downtime as a range, not a dramatic headline
Downtime estimates are often the weakest part of a TCO model. Separate frequency, consequence and mitigation.
For each credible event, record:
- estimated occurrence frequency or scenario;
- repair or replacement time;
- production effect per hour or batch;
- existing redundancy;
- stocked spare and change-out time;
- technical support and transport delay.
Run at least a low, base and high case. If downtime assumptions dominate the result, management should see that sensitivity rather than a single precise-looking number.
Maintenance needs model-specific evidence
Avoid assigning a generic maintenance cost to “induction” and another to “permanent magnet.” Ask what the actual design contains and how the site will support it.
Include bearings, grease, seals, cooling fans, brakes, encoders, space heaters, filters, vibration monitoring and specialist tools as applicable. For a PM motor or integrated drive, consider diagnostic capability and replacement strategy. For a large induction motor, include inspection and rewind decisions. The useful comparison follows service tasks, intervals and parts—not technology labels.
Add sensitivity before presenting payback
At minimum, vary:
- annual hours;
- average load;
- electricity tariff;
- efficiency difference;
- study life;
- installation cost;
- downtime consequence.
Show which two inputs move the answer most. That tells the team what to measure next. If a modest change in hours eliminates the apparent payback, the project needs better operating data before approval.
A practical decision sequence
- Reject options that fail safety, compliance or application fit.
- Define a common supply and installation boundary.
- Build the actual duty profile from measurements where possible.
- Calculate energy for comparable operating points.
- Add installation, maintenance and spares.
- Model downtime as scenarios with stated owners.
- Run sensitivity cases.
- Record non-cost differences separately for the decision maker.
TCO does not make the decision. It makes the assumptions visible enough for procurement, engineering, operations and finance to challenge the same model.