
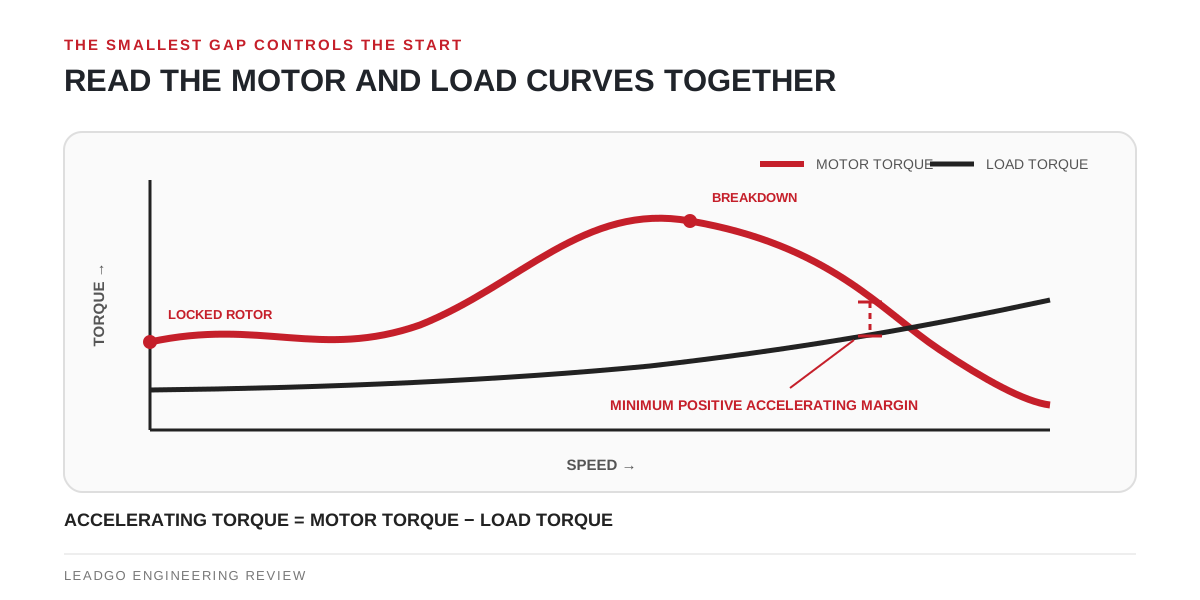
A torque-speed curve is not a decorative motor characteristic. It is a map of whether the selected motor can break the load away, pass the weakest acceleration region and reach a stable operating point before thermal or protection limits intervene.
Put motor torque and load torque on one axis
The horizontal axis is speed, normally from standstill to operating speed. The vertical axis is torque, but the units and base must be explicit. A percentage curve is useful only when motor and load percentages share a documented torque base.
Overlay the driven-equipment torque on the motor curve. At every speed where the motor accelerates, the available motor torque must exceed the resisting load torque. Their difference is accelerating torque:
Accelerating torque = motor torque − load torque
A positive value starts or continues acceleration. The smallest positive gap is the vulnerable region. If the curves cross before the intended operating point, the system can settle, stall or trip there rather than reaching rated speed.
Read each curve zone for a different decision
| Curve location | What it represents | What it can confirm | What it cannot confirm alone |
|---|---|---|---|
| Standstill/locked rotor | Motor torque at zero speed under the stated supply | Whether initial motor torque exceeds breakaway load torque | Passage through the rest of acceleration |
| Pull-up region | The minimum motor torque before breakdown | The weakest motor-only torque point during run-up | Margin after the load curve is added |
| Breakdown region | Maximum torque before an abrupt speed drop under the defined condition | Available peak torque capability on that basis | Permissible duration or repeated overload duty |
| Near rated speed | Intersection associated with the declared operating point | Rated torque and speed relationship | Performance at every process or supply condition |
| Beyond stable operating point | Region approaching synchronous speed | Shape of the motor characteristic | A normal continuous operating target for a cage induction motor |
The formal NEMA definitions for pull-up and breakdown torque appear in NEMA MG 1 Part 1. Keep those terms separate when reviewing supplier curves; “starting torque” does not describe the minimum torque later in acceleration.
Draw the load that will actually start
Different machines resist acceleration differently. A conveyor may have meaningful breakaway friction. A loaded reciprocating compressor can present a cyclic demand. A centrifugal fan or pump often has a speed-dependent running characteristic, but dampers, check valves, static head and process state can change the start.
Request the load supplier’s torque-speed curve for the specified start condition. Also identify:
- whether the machine starts unloaded, vented, closed, full or partially full;
- transmission ratio and efficiency;
- motor, coupling and load inertia referred to a common shaft;
- cold or hot mechanical condition;
- any speed bands with resonance, lubrication or process restrictions.
Using rated load torque as a horizontal line is acceptable only when it genuinely represents the driven machine’s start. It must not be a convenient placeholder.
Rebuild the motor curve at the terminal condition
A nominal curve normally has a stated voltage, frequency, connection and test/calculation basis. The motor terminals may see something else during start because the transformer, generator, feeder and starter all contribute voltage drop or waveform changes.
For direct-on-line assessment, pair the network voltage-drop study with the motor curve. For star-delta, autotransformer, soft-starter or drive starting, use the supplier’s applicable torque and current data for that method. Do not apply a simple voltage rule to a controlled or non-sinusoidal start unless the responsible supplier and study procedure support it.
IEC 60034-12:2024 is the current IEC starting-performance reference for single-speed three-phase cage induction motors within its stated scope. The ABB Distribution Automation Handbook provides a useful equivalent-circuit and torque-versus-slip explanation, but project acceptance still requires data for the offered motor and load.
Convert torque margin into a time check
A wide-looking gap on a plotted curve is not yet an acceleration-time result. The calculation must integrate accelerating torque with combined inertia across speed. That time is then checked against:
- the motor’s permitted starting and stall conditions;
- starter and switching-device duty;
- cable and transformer short-duration effects;
- protection curves and relay logic;
- process limits and permissible starts per operating period.
Record the curve revision and digital data if available. A low-resolution image can hide a narrow intersection that materially changes the calculated time.
Approve the pair, not the motor in isolation
The release record should identify the offered motor, starting method, minimum terminal-voltage case, load state, both curves, inertias, acceleration result, thermal check and protection disposition. If the driven equipment, feeder or starter changes, reopen the shared assumptions.
The practical question is therefore not “Does the motor have high starting torque?” It is “Where is the minimum accelerating-torque margin for this motor-load-system combination, and can it remain there safely for the calculated time?”